Chromagraphic Analysis
In targeted proteomics, such as SRM / MRM / PRM / DIA applications, groups of chromatograms need to be analyzed frequently. OpenMS provides several powerful tools for analysis of chromatograms. Most of them are part of the OpenSWATH suite of tools and are also discussed in the OpenSwath documentation.
Peak Detection
Here, we will focus on a simple example where 2 peptides are analyzed. We will need 2 input files: the chromatogram files that contains the chromatographic raw data (raw SRM traces or extracted ion chromatograms from PRM/DIA data) as well as the library file used to generated the data which contains information about the targeted peptides:
from urllib.request import urlretrieve
# from urllib import urlretrieve  # use this code for Python 2.x
from pyopenms import *
gh = "https://raw.githubusercontent.com/OpenMS/OpenMS/develop"
urlretrieve (gh +"/src/tests/topp/OpenSwathAnalyzer_1_input_chrom.mzML", "chrom.mzML")
urlretrieve (gh +"/src/tests/topp/OpenSwathAnalyzer_1_input.TraML", "transitions.TraML")

chroms = MSExperiment()
library = TargetedExperiment()
MzMLFile().load("chrom.mzML", chroms)
TraMLFile().load("transitions.TraML", library)

# Investigate library
for t in library.getTransitions():
   print ("Transition", t.getNativeID(), "belongs to peptide group", t.getPeptideRef())

print ("Input contains", len(library.getTransitions()), "transitions and", len(chroms.getChromatograms()), "chromatograms.")
features = FeatureMap()
dummy_trafo = TransformationDescription()
dummy_exp = MSExperiment()
MRMFeatureFinderScoring().pickExperiment(chroms, features, library, dummy_trafo, dummy_exp)
for f in features:
  print ("Feature for group", f.getMetaValue("PeptideRef"), "with precursor m/z", f.getMetaValue("PrecursorMZ"))
  print ("  Feature found at RT =", f.getRT(), "with library dot product", f.getMetaValue("var_library_dotprod"))
Here we see that for the first group of transitions (tr_gr1), a single peak
at retention time 3119 seconds was found. However, for the second group of
transitions, two peaks are found at retention times 3119 seconds and at
3055 seconds.
Visualization
We can confirm the above analysis by visual inspection of the chrom.mzML
file produced above in the TOPPView software:
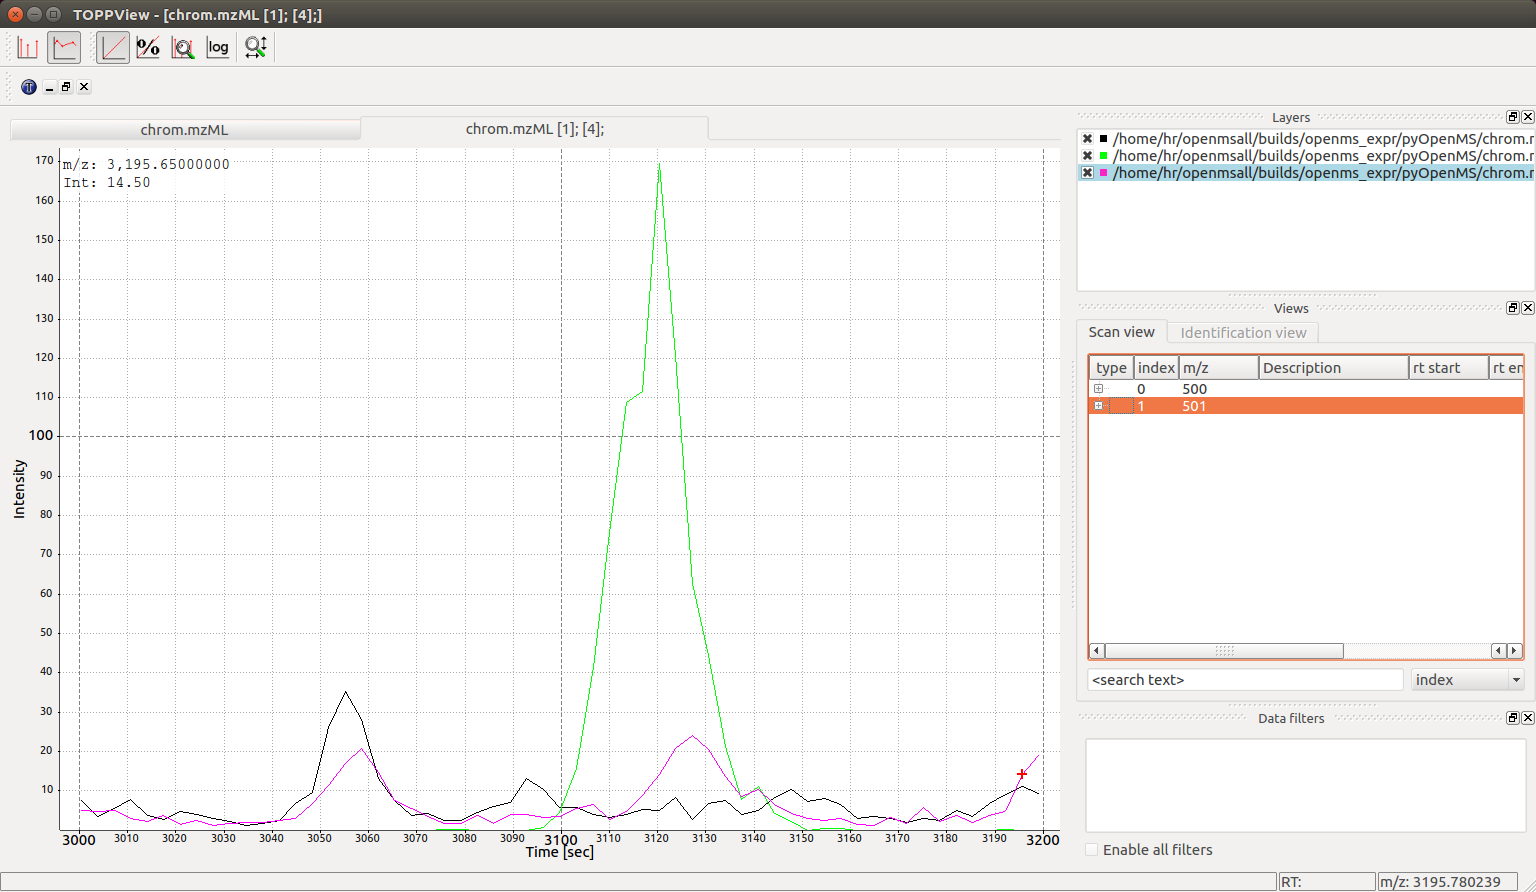
However, our output above contains more information than only retention time:
Feature for group tr_gr1 with precursor m/z 500.0
  Feature found at RT = 3119.091968219877 with library dot product 0.9924204062692046
Feature for group tr_gr2 with precursor m/z 501.0
  Feature found at RT = 3055.584481870532 with library dot product 0.952054383474221
Feature for group tr_gr2 with precursor m/z 501.0
  Feature found at RT = 3119.0630105310684 with library dot product 0.7501676755451506
Based on the output above, we can infer that the peak at 3055 seconds is
likely the correct peak for tr_gr2 since it has a high library dot product
(0.95) while the peak at 3119 seconds is likely incorrect for tr_gr2 since
its dot product is low (0.75). We also see that a peak at 3119 seconds is
likely correct for tr_gr1 since it matches well with the expected library
intensities and has a high dot product (0.99).
Note: to get an overview over all available scores for a particular MRM feature f, you can use
k = []
f.getKeys(k)
print (k)
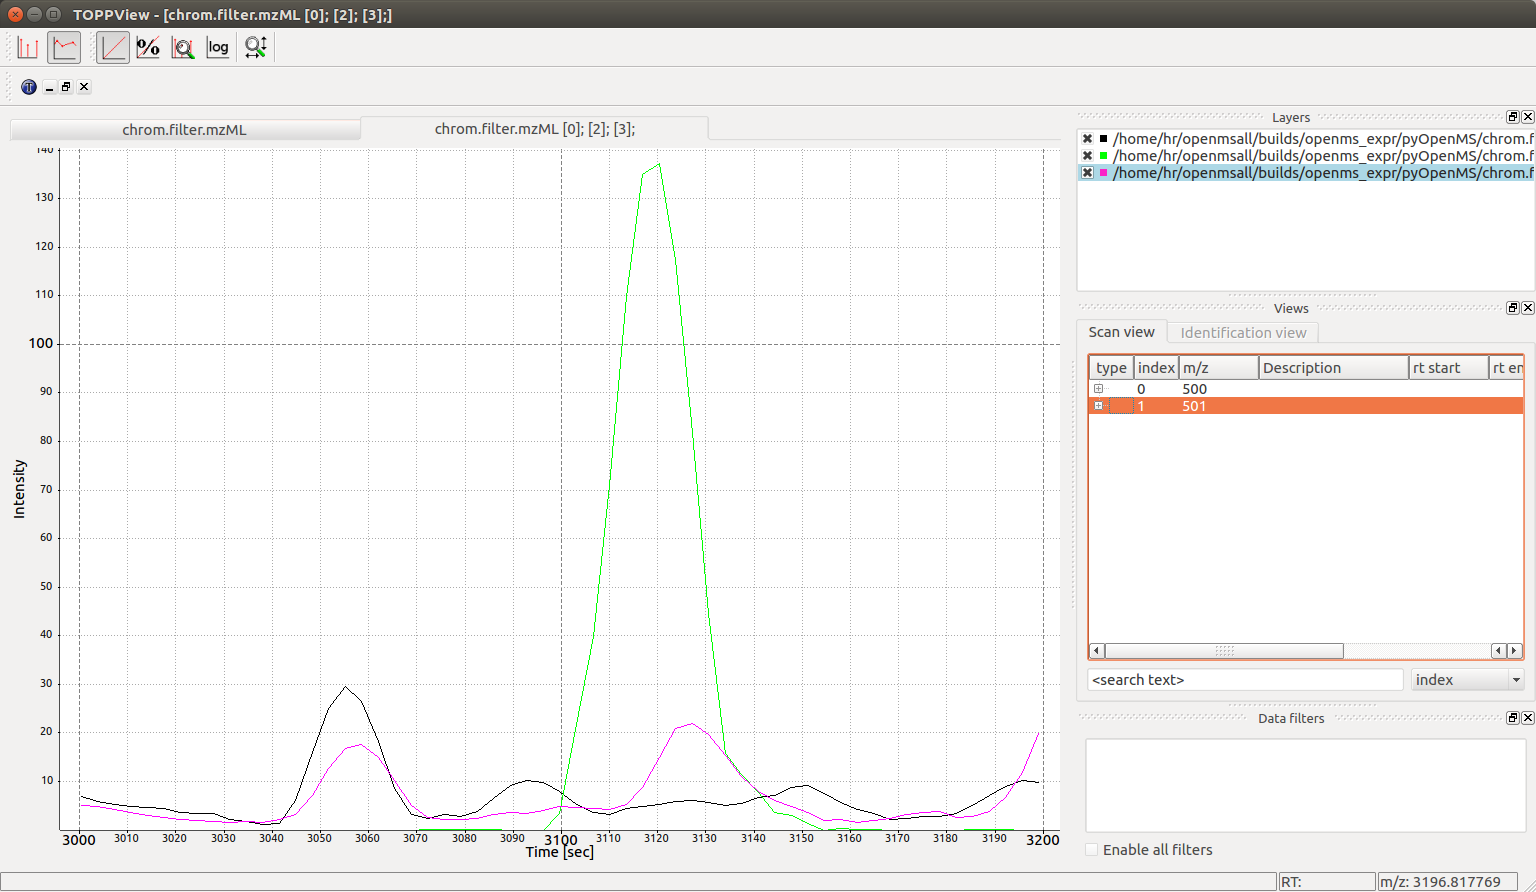
Smoothing
Now you may want to show the chromatograms to your collaborator, but you notice that most software solutions smooth the chromatograms before display. In order to provide smooth chromatograms, you can apply a filter using pyOpenMS:
sg = SavitzkyGolayFilter()
sg.filterExperiment(chroms)
MzMLFile().store(chroms, "chrom.filter.mzML")
Which leads to the following smoothed chromatographic traces: