
Centroiding#
MS instruments typically allow storing spectra in profile mode (several data points per m/z peak) or in the more condensed centroid mode (one data point per m/z peak). The process of converting a profile mass spectrum into a centroided one is called peak centroiding or peak picking.
Note
The term peak picking is ambiguous as it is also used for features detection (i.e., 3D peak finding).
First, we load some profile data:
1from urllib.request import urlretrieve
2import pyopenms as oms
3import matplotlib.pyplot as plt
4
5gh = "https://raw.githubusercontent.com/OpenMS/OpenMS/develop/doc/pyopenms"
6urlretrieve(gh + "/src/data/PeakPickerHiRes_input.mzML", "tutorial.mzML")
7
8profile_spectra = oms.MSExperiment()
9oms.MzMLFile().load("tutorial.mzML", profile_spectra)
Let’s zoom in on an isotopic pattern in profile mode and plot it.
1plt.xlim(771.8, 774)  # zoom into isotopic pattern
2plt.plot(
3    profile_spectra[0].get_peaks()[0], profile_spectra[0].get_peaks()[1]
4)  # plot the first spectrum
5plt.show()
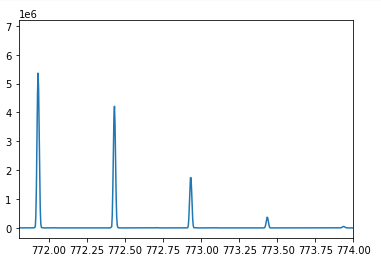
Due to the limited resolution of mass spectrometry (MS) instruments, m/z measurements exhibit a certain spread when multiple copies of a molecule are measured. Even with identical mass and charge, the copies are recorded with slight deviations in the m/z dimension. Consequently, peak shapes in this dimension adopt a Gaussian-like distribution. The number of copies correlates with the peak height (or rather peak volume).
A single peptide species, e.g. “DPFINAGER” at charge 2, typically consists of various molecular entities that differ in the number of neutrons, leading to an isotopic distribution and resulting in multiple peaks.
Using the PeakPickerHiRes algorithm, we can convert data from profile to centroided mode. Usually, not much information is lost
by storing only centroided data. Thus, many algorithms and tools assume that centroided data is provided.
 1centroided_spectra = oms.MSExperiment()
 2
 3# input, output, chec_spectrum_type (if set, checks spectrum type and throws an exception if a centroided spectrum is passed)
 4oms.PeakPickerHiRes().pickExperiment(
 5    profile_spectra, centroided_spectra, True
 6)  # pick all spectra
 7
 8plt.xlim(771.8, 774)  # zoom into isotopic pattern
 9plt.stem(
10    centroided_spectra[0].get_peaks()[0], centroided_spectra[0].get_peaks()[1]
11)  # plot as vertical lines
12plt.show()
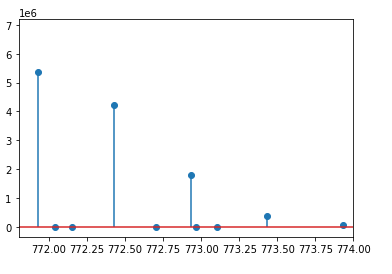
After centroiding, a single m/z value for every isotopic peak is retained. By plotting the centroided data as stem plot we discover that (in addition to the isotopic peaks) some low intensity peaks (intensity at approx. 4k units on the y-axis) were present in the profile data.