Spectrum Alignment#
OpenMS provides several ways to find matching peaks between two mass spectra.
The most basic one SpectrumAlignment returns a list of matching peak indices between a query and target mass spectrum.
In this example, we take an observed (measured) mass spectrum and align a theoretical mass spectrum to it.
First we load a (chemically modified) peptide:
 1from urllib.request import urlretrieve
 2import pyopenms as oms
 3
 4gh = "https://raw.githubusercontent.com/OpenMS/OpenMS/develop/doc/pyopenms"
 5urlretrieve(
 6    gh + "/src/data/YIC(Carbamidomethyl)DNQDTISSK.mzML", "observed.mzML"
 7)
 8
 9exp = oms.MSExperiment()
10# Load mzML file and obtain spectrum for peptide YIC(Carbamidomethyl)DNQDTISSK
11oms.MzMLFile().load("observed.mzML", exp)
12
13# Get first spectrum
14spectra = exp.getSpectra()
15observed_spectrum = spectra[0]
Now we generate the theoretical mass spectrum of that peptide:
1tsg = oms.TheoreticalSpectrumGenerator()
2theo_spectrum = oms.MSSpectrum()
3p = tsg.getParameters()
4p.setValue("add_y_ions", "true")
5p.setValue("add_b_ions", "true")
6p.setValue("add_metainfo", "true")
7tsg.setParameters(p)
8peptide = oms.AASequence.fromString("YIC(Carbamidomethyl)DNQDTISSK")
9tsg.getSpectrum(theo_spectrum, peptide, 1, 2)
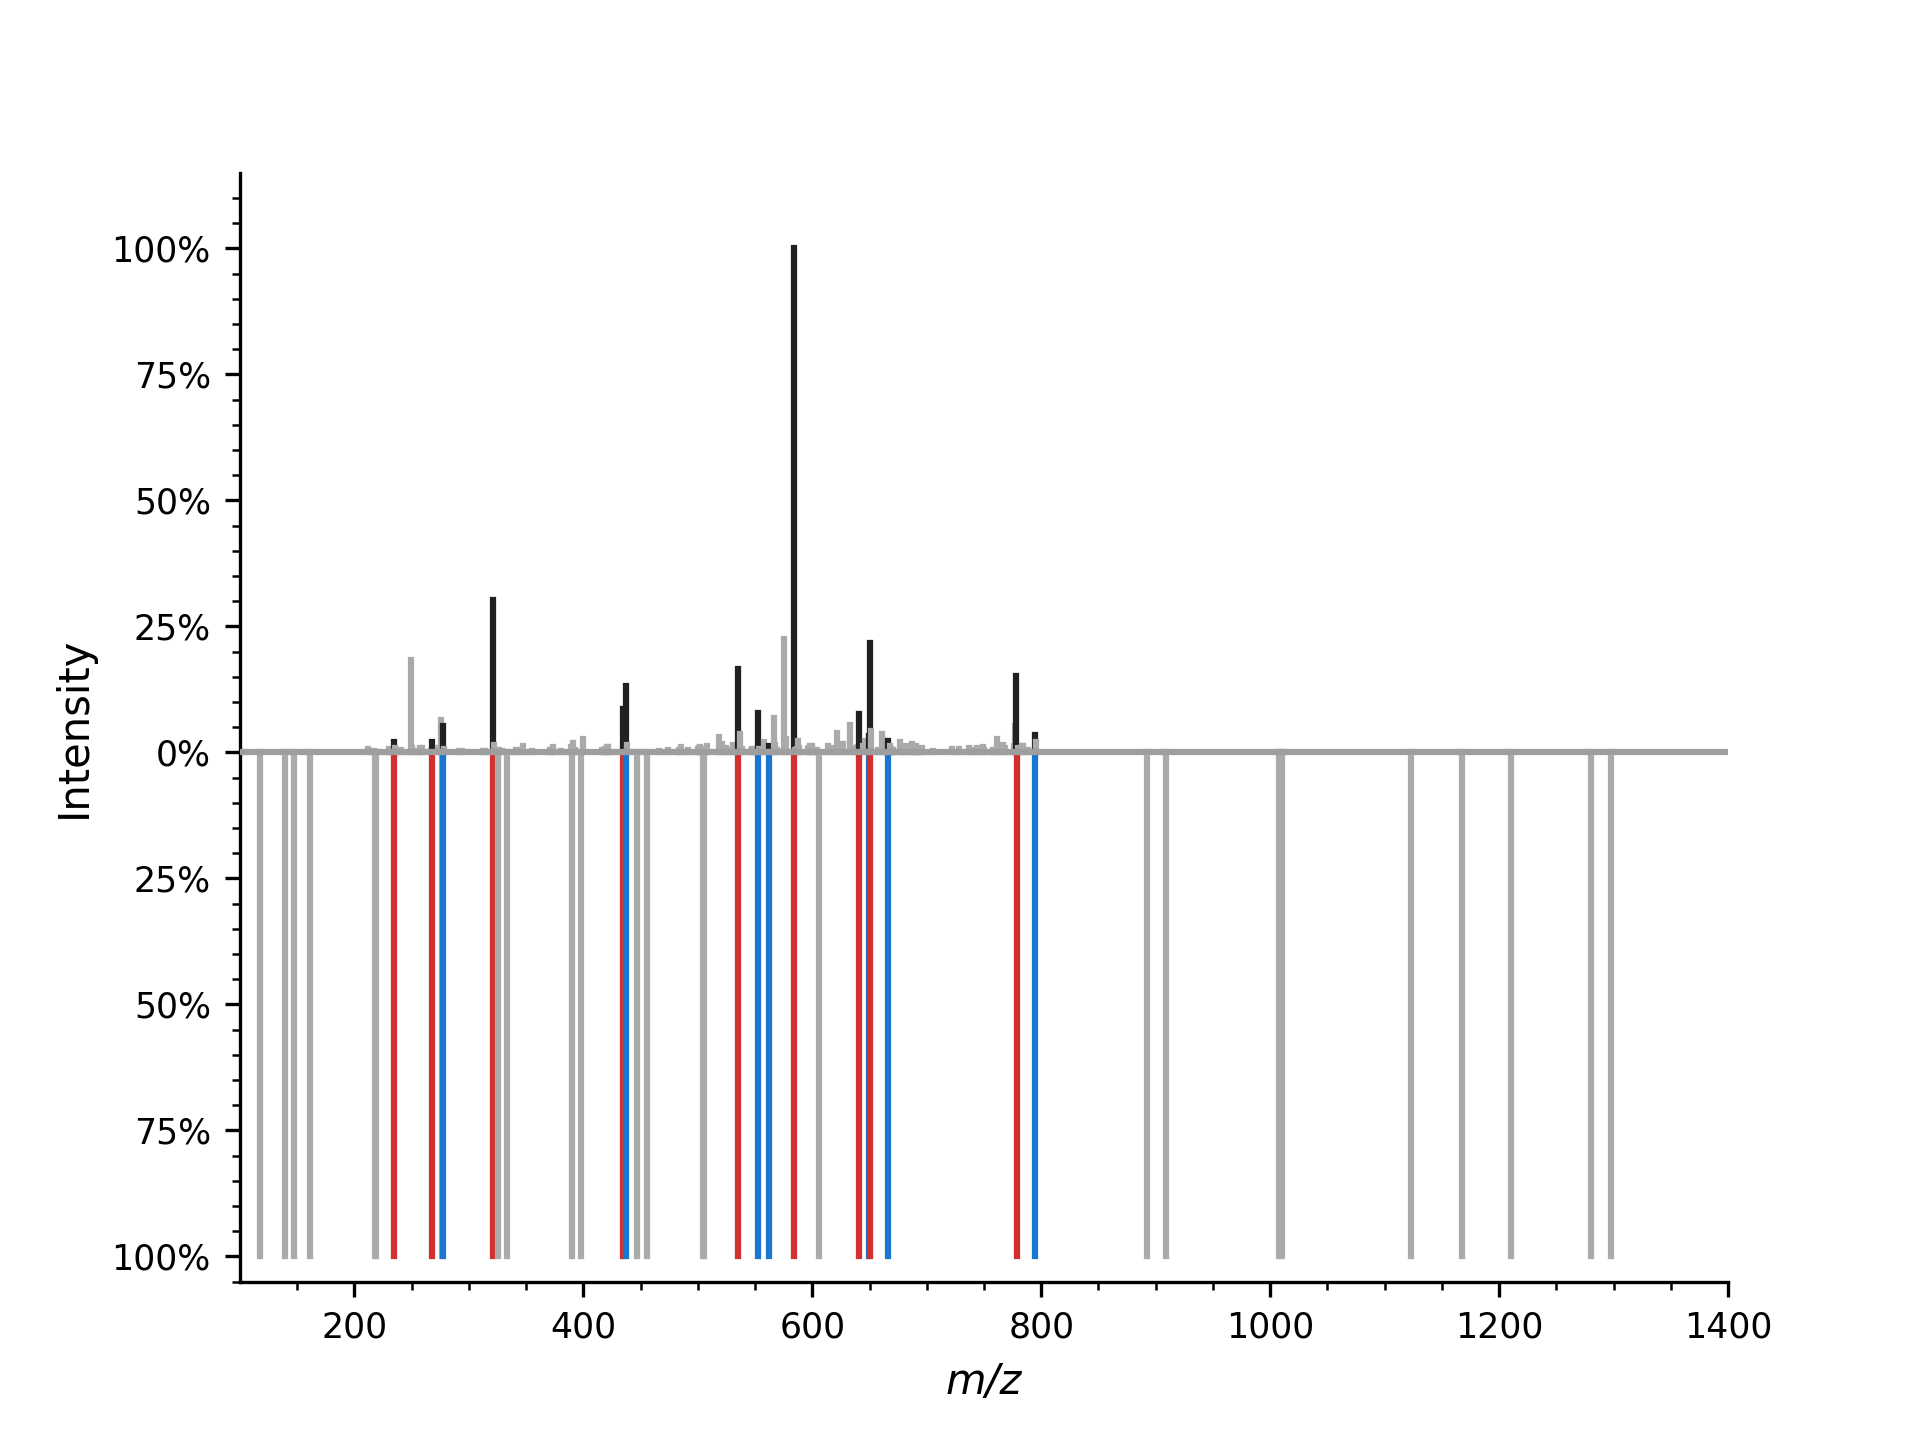
Now we can plot the observed and theoretical mass spectrum as a mirror plot:
1import matplotlib.pyplot as plt
2from pyopenms.plotting import mirror_plot_spectrum
3
4mirror_plot_spectrum(
5    observed_spectrum,
6    theo_spectrum,
7    spectrum_bottom_kws={"annotate_ions": False},
8)
9plt.show()
which produces
Now we want to find matching peaks (in m/z) between the observed and the theoretical spectrum (note: we ignore the peak intensity during the alignment).
1alignment = []
2spa = oms.SpectrumAlignment()
3p = spa.getParameters()
4# use 0.5 Da tolerance for m/z (Note: for high-resolution data we could also use ppm by setting the is_relative_tolerance value to true)
5p.setValue("tolerance", 0.5)
6p.setValue("is_relative_tolerance", "false")
7spa.setParameters(p)
8# align both spectra
9spa.getSpectrumAlignment(alignment, theo_spectrum, observed_spectrum)
The alignment contains a list of matched peak indices. We can simply inspect matching peaks with:
 1from tabulate import tabulate
 2
 3
 4# Print matching ions and mz from theoretical spectrum
 5print("Number of matched peaks: " + str(len(alignment)))
 6t = []
 7for theo_idx, obs_idx in alignment:
 8    ion_name = theo_spectrum.getStringDataArrays()[0][theo_idx].decode()
 9    ion_charge = theo_spectrum.getIntegerDataArrays()[0][theo_idx]
10    t.append(
11        [
12            ion_name,
13            str(ion_charge),
14            str(theo_spectrum[theo_idx].getMZ()),
15            str(observed_spectrum[obs_idx].getMZ()),
16        ]
17    )
18print(tabulate(t, headers=["ion", "charge", "theo. m/z", "observed m/z"]))
Number of matched peaks: 16
ion      charge    theo. m/z    observed m/z
-----  --------  -----------  --------------
y2+           1      234.145         234.123
y5++          2      268.158         268.105
b2+           1      277.155         277.246
y3+           1      321.177         321.297
y4+           1      434.261         434.288
b3+           1      437.185         437.291
y5+           1      535.309         535.189
b4+           1      552.212         552.338
b9++          2      562.24          562.421
y10++         2      584.251         584.412
y11++         2      640.793         640.954
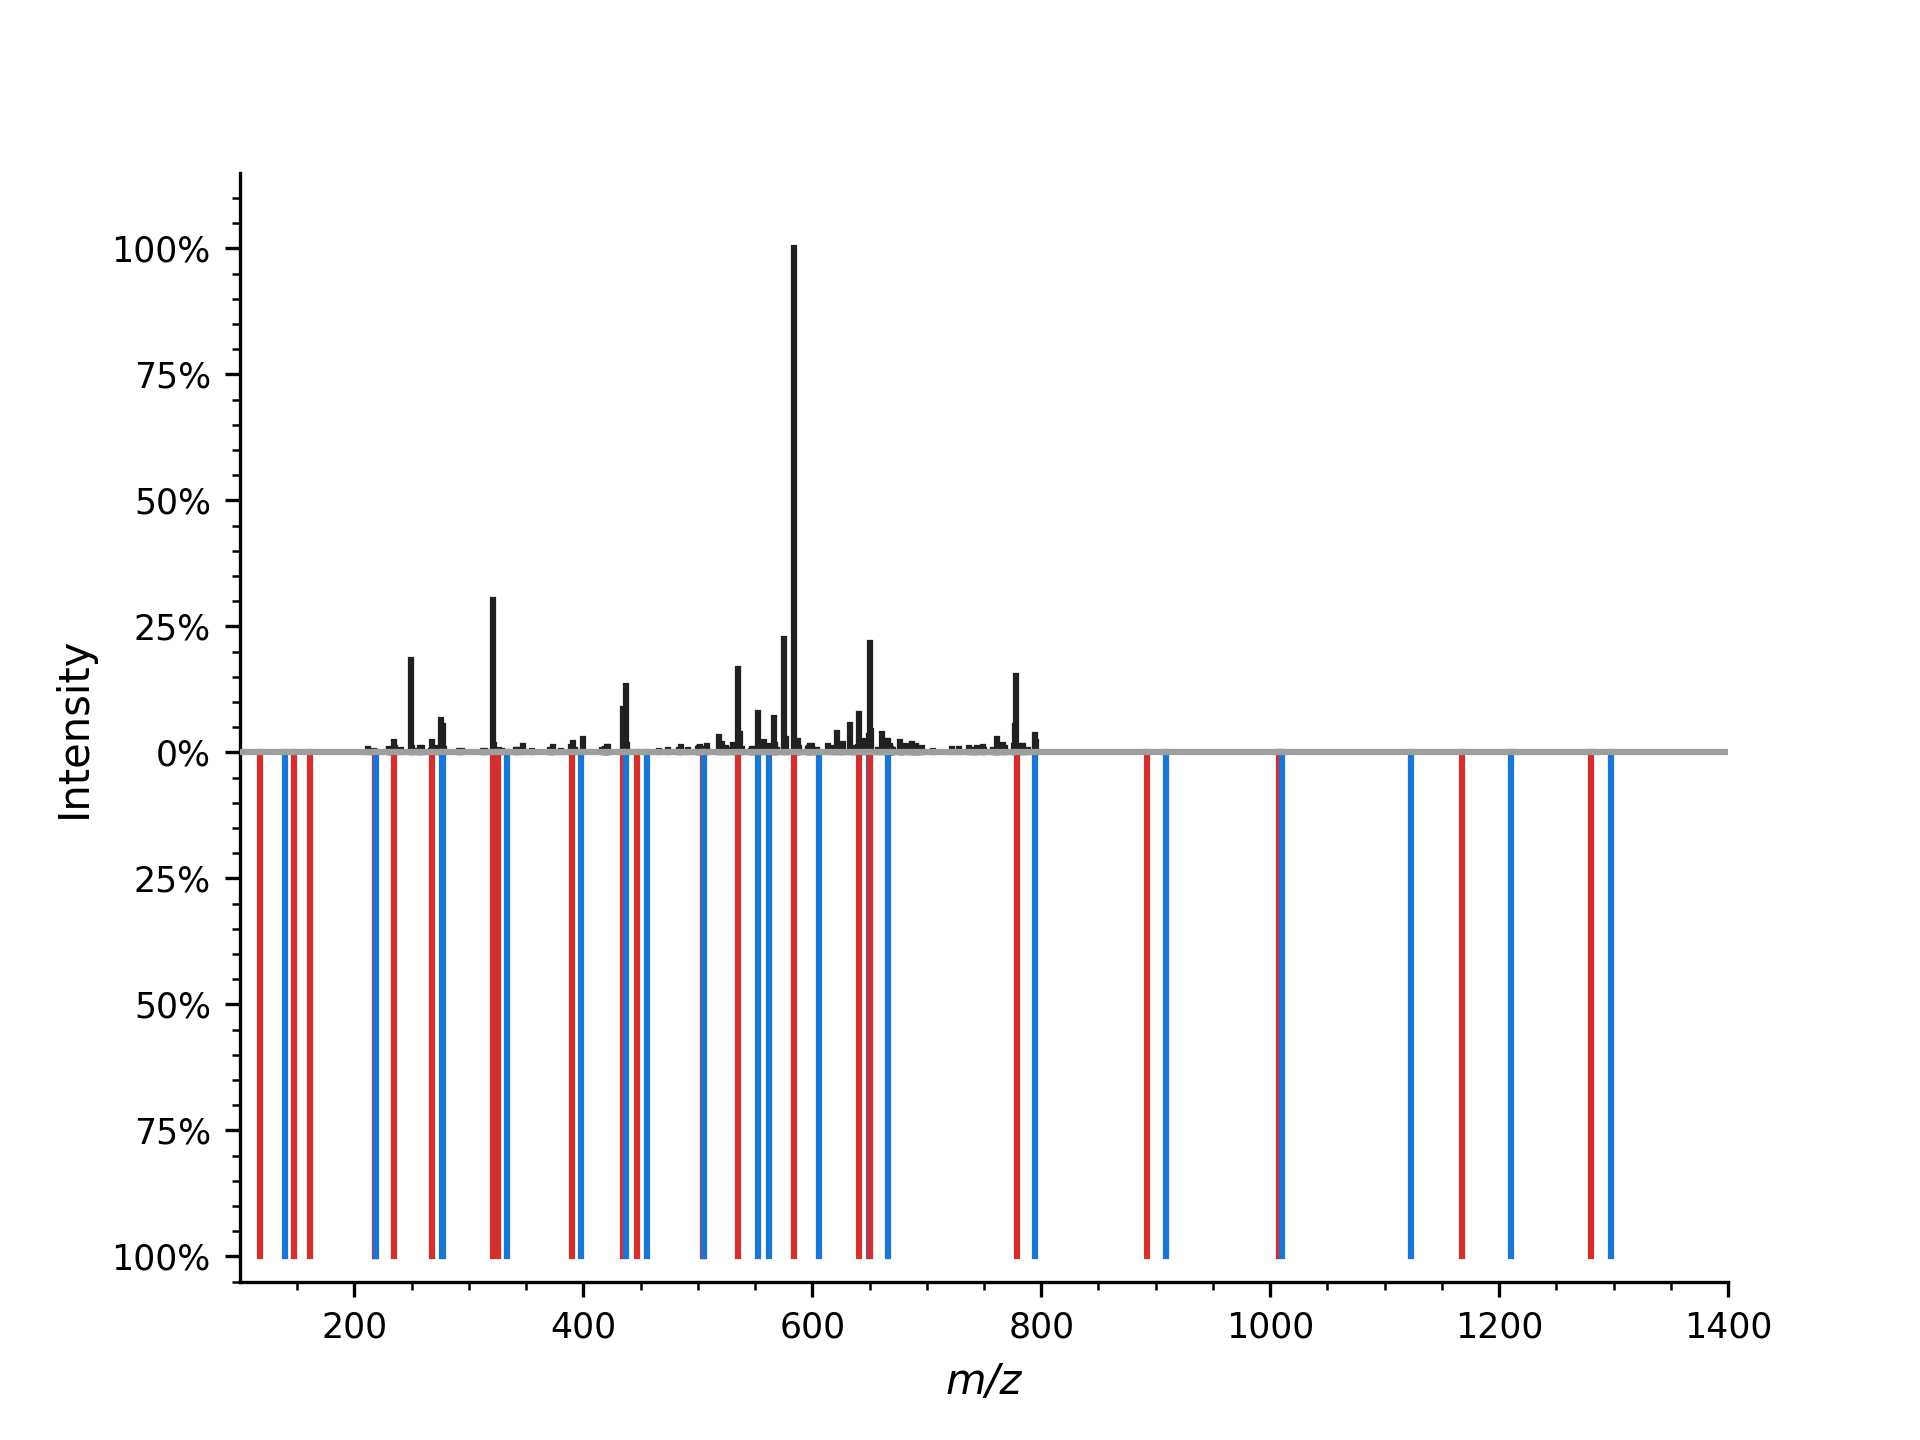
The mirror plot can also be used to visualize the aligned mass spectrum:
1match_peaks_observed, match_peaks_theoretical = list(zip(*alignment))
2mirror_plot_spectrum(
3    observed_spectrum,
4    theo_spectrum,
5    spectrum_top_kws={"matched_peaks": match_peaks_theoretical},
6    spectrum_bottom_kws={"annotate_ions": False, "matched_peaks": match_peaks_observed}
7)
8plt.show()
which produces