Spectrum Normalization#
Normalization by base peak intensity is a fundamental processing step in mass spectrometry. This method scales the peak intensities in a spectrum such that the highest peak reaches a maximum value, typically set to one. This approach facilitates the comparison of different spectra by standardizing the intensity scale.
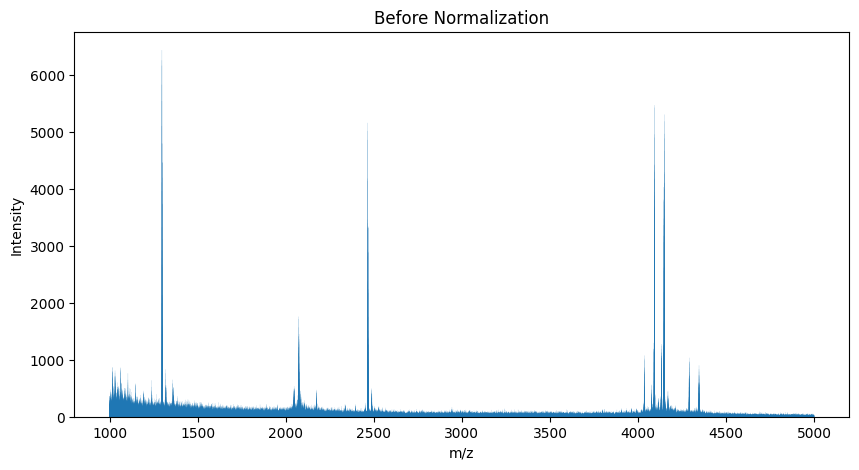
Loading the Raw Data#
To begin, we need to load the mass spectrometry data. The following Python code demonstrates how to load a spectrum from an mzML file using the pyOpenMS library.
 1from urllib.request import urlretrieve
 2import pyopenms as oms
 3import matplotlib.pyplot as plt
 4
 5gh = "https://raw.githubusercontent.com/OpenMS/OpenMS/develop/doc/pyopenms"
 6urlretrieve(gh + "/src/data/peakpicker_tutorial_1_baseline_filtered.mzML", "tutorial.mzML")
 7
 8exp = oms.MSExperiment()
 9oms.MzMLFile().load("tutorial.mzML", exp)
10
11plt.bar(exp.getSpectrum(0).get_peaks()[0], exp.getSpectrum(0).get_peaks()[1], snap=False)
12plt.show()
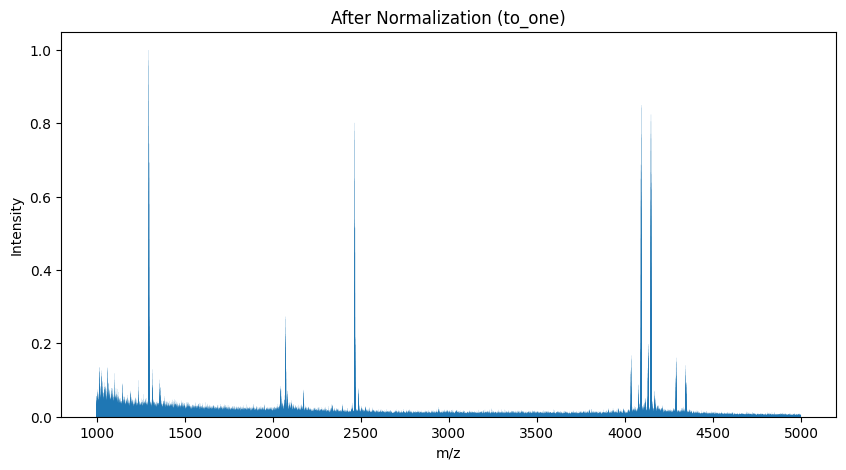
Normalization Procedure#
After loading the data, the next step is to apply normalization. We use
the Normalizer class.
1normalizer = oms.Normalizer()
2param = normalizer.getParameters()
3param.setValue("method", "to_one")
4normalizer.setParameters(param)
5
6normalizer.filterPeakMap(exp)
7plt.bar(exp.getSpectrum(0).get_peaks()[0], exp.getSpectrum(0).get_peaks()[1], snap=False)
8plt.show()
To list all available normalization methods of the Normalizer, either look into its documentation, or
query the valid values of its method parameter:
1normalizer = oms.Normalizer()
2param = normalizer.getParameters()
3print(param.getValidStrings("method"))  # [b'to_one', b'to_TIC']
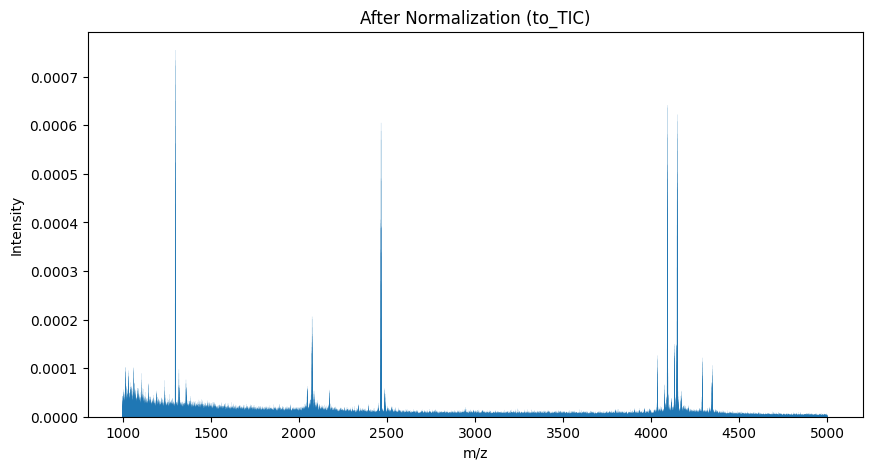
TIC Normalization#
Another approach to normalization is using the Total Ion Count (TIC). This method adjusts the intensities so that their total sum equals 1.0 in each mass spectrum.
1param.setValue("method", "to_TIC")
2normalizer.setParameters(param)
3normalizer.filterPeakMap(exp)
4plt.bar(exp.getSpectrum(0).get_peaks()[0], exp.getSpectrum(0).get_peaks()[1], snap=False)
5plt.show()