Import pyOpenMS#
After installation, you should be able to import pyOpenMS as a package
import pyopenms
which should now give you access to all of pyOpenMS. You should now be able to interact with the OpenMS library and, for example, read and write mzML files:
import pyopenms as oms

exp = oms.MSExperiment()
oms.MzMLFile().store("testfile.mzML", exp)
which will create an empty mzML file called testfile.mzML.
Using the Help Function#
There are multiple ways to get information about the available functions and
methods. We can inspect individual pyOpenMS objects through the Python help
function:
help(oms.MSExperiment)
class MSExperiment(builtins.object)
 |  Cython implementation of _MSExperiment
 |   -- Inherits from ['ExperimentalSettings', 'RangeManager2']
 |
 |  In-Memory representation of a mass spectrometry experiment.
 |  -----
 |  Contains the data and metadata of an experiment performed with an MS (or
 |  HPLC and MS). This representation of an MS experiment is organized as list
 |  of spectra and chromatograms and provides an in-memory representation of
 |  popular mass-spectrometric file formats such as mzXML or mzML. The
 |  meta-data associated with an experiment is contained in
 |  ExperimentalSettings (by inheritance) while the raw data (as well as
 |  spectra and chromatogram level meta data) is stored in objects of type
 |  MSSpectrum and MSChromatogram, which are accessible through the getSpectrum
 |  and getChromatogram functions.
 |  -----
 |  Spectra can be accessed by direct iteration or by getSpectrum(),
 |  while chromatograms are accessed through getChromatogram().
 |  See help(ExperimentalSettings) for information about meta-data.
 |
 |  Methods defined here:

 [...]
which lists information on the MSExperiment class, including a
description of the main purpose of the class and how the class is intended to
be used. Additional useful information is presented in the Inherits from
section which points to additional classes that act as base classes to
MSExperiment and that contain further information.
The list of available methods is long (but does not include methods from the
base classes) and reveals that the class exposes methods such as
getNrSpectra() and getSpectrum(id)() where the argument id indicates
the spectrum identifier. The command also lists the signature for each
function, allowing users to identify the function arguments and return types.
We can gain further information about exposed methods by investigating the
documentation of the base classes:
help(oms.ExperimentalSettings)
Help on class ExperimentalSettings in module pyopenms.pyopenms_4:

class ExperimentalSettings(builtins.object)
 |  Cython implementation of _ExperimentalSettings
 |   -- Inherits from ['DocumentIdentifier', 'MetaInfoInterface']
 |
 |  Description of the experimental settings, provides meta-information
 |  about an LC-MS/MS injection.
 |
 |  Methods defined here:

 [...]
We could now continue our investigation by reading the documentation of the
base classes DocumentIdentifier and MetaInfoInterface, but we will
leave this exercise for the interested reader. For a more complete documentation of the underlying
wrapped methods, please consult the official OpenMS documentation, in this case
the MSExperiment documentation.
First Look at Data#
File Reading#
pyOpenMS supports a variety of different files through the implementations in OpenMS. In order to read mass spectrometric data, we can download the mzML example file:
from urllib.request import urlretrieve

# download small example file
gh = "https://raw.githubusercontent.com/OpenMS/OpenMS/develop/doc/pyopenms"
urlretrieve(gh + "/src/data/tiny.mzML", "tiny.mzML")
exp = oms.MSExperiment()
# load example file
oms.MzMLFile().load("tiny.mzML", exp)
which will load the content of the tiny.mzML file into the exp
variable of type MSExperiment.
We can now inspect the properties of this object:
help(exp)
class MSExperiment(builtins.object)
 |  Cython implementation of _MSExperiment
 |   -- Inherits from ['ExperimentalSettings', 'RangeManager2']


 [...]

 |  Methods defined here:

 [...]

 |  getNrChromatograms(...)
 |      Cython signature: size_t getNrChromatograms()
 |
 |  getNrSpectra(...)
 |      Cython signature: size_t getNrSpectra()
 |

 [...]
which indicates that the variable exp has (among others) the functions
getNrSpectra and getNrChromatograms. We can now try these functions:
print(exp.getNrSpectra())
print(exp.getNrChromatograms())
4
2
and indeed we see that we get information about the underlying MS data. We can iterate through the spectra as follows:
Iteration#
for spec in exp:
    print("MS Level:", spec.getMSLevel())
MS Level: 1
MS Level: 2
MS Level: 1
MS Level: 1
This iterates through all available MSSpectra, we can also access spectra through the [] operator:
print("MS Level:", exp[1].getMSLevel())
MS Level: 2
Note that spec[1] will access the second spectrum (arrays start at
0). We can access the raw peaksthrough get_peaks():
spec = exp[1]
mz, intensity = spec.get_peaks()
print(sum(intensity))
110
Which will access the data using a numpy array, storing the m/z information
in the mz vector and the intensity in the i vector. Alternatively, we
can also iterate over individual peaks objects as follows (this tends to be
slower):
for peak in spec:
    print(peak.getIntensity())
20.0
18.0
16.0
14.0
12.0
10.0
8.0
6.0
4.0
2.0
Total Ion Current Calculation#
Here, we will apply what we have learned to calculate the total ion current (TIC). The TIC represents the summed intensity across the entire range of masses being detected at every point in the analysis. Basically, we calculate the total ion current of the whole experiment.
With this information, we can write a function that calculates the TIC for a given MS level:
# Calculates total ion current of an LC-MS/MS experiment
def calcTIC(exp, mslevel):
    tic = 0
    # Iterate through all spectra of the experiment
    for spec in exp:
        # Only calculate TIC for matching (MS1) spectra
        if spec.getMSLevel() == mslevel:
            mz, i = spec.get_peaks()
            tic += sum(i)
    return tic
To calculate a TIC we would now call the function:
print(calcTIC(exp, 1))
print(sum([sum(s.get_peaks()[1]) for s in exp if s.getMSLevel() == 1]))
print(calcTIC(exp, 2))
240.0
240.0
110.0
Note how one can compute the same property using list comprehensions in Python
(see line number 3 in the above code which computes the TIC using filtering
properties of Python list comprehensions (s.getMSLevel() == 1) and computes
the sum over all peaks(right sum) and the sum over all spectra (left
sum) to retrieve the TIC).
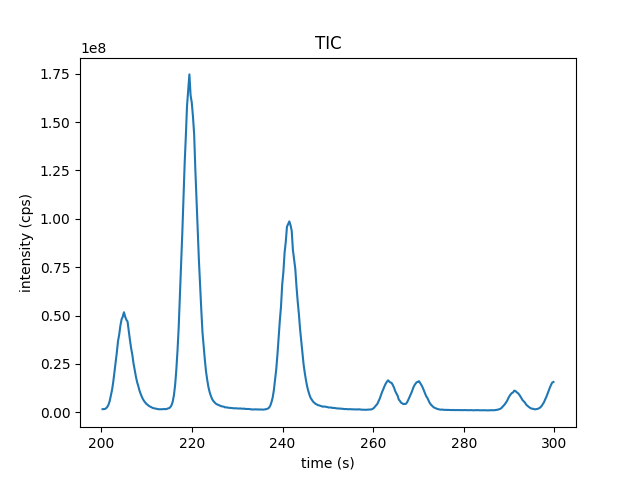
Total Ion Current Chromatogram#
The total ion current is visualized over the retention time, to allow for the inspection of areas with general high intensity (usually multiple analytes were measured there). This can help the experimentalist to optimize the chromatography for a better separation in a specific area.
While some mzML files already contain a pre-computed total ion current chromatogram (TIC),
we will show you how to calculate the TIC for MS1. One can access the retention times
and intensities of the TIC in different ways and generate a total ion current chromatogram
(2D graph) using matplotlib:
 1import matplotlib.pyplot as plt
 2from urllib.request import urlretrieve
 3
 4# retrieve MS data
 5gh = "https://raw.githubusercontent.com/OpenMS/OpenMS/develop/doc/pyopenms"
 6urlretrieve(
 7    gh + "/src/data/FeatureFinderMetaboIdent_1_input.mzML", "ms_data.mzML"
 8)
 9
10# load MS data into MSExperiment()
11exp = oms.MSExperiment()
12oms.MzMLFile().load("ms_data.mzML", exp)
13
14# choose one of the following three methods to access the TIC data
15# 1) recalculate TIC data with the calculateTIC() function
16tic = exp.calculateTIC()
17retention_times, intensities = tic.get_peaks()
18
19# 2) get TIC data using list comprehensions
20retention_times = [spec.getRT() for spec in exp]
21intensities = [
22    sum(spec.get_peaks()[1]) for spec in exp if spec.getMSLevel() == 1
23]
24
25# 3) get TIC data looping over spectra in MSExperiment()
26retention_times = []
27intensities = []
28for spec in exp:
29    if spec.getMSLevel() == 1:
30        retention_times.append(spec.getRT())
31        intensities.append(sum(spec.get_peaks()[1]))
32
33# plot retention times and intensities and add labels
34plt.plot(retention_times, intensities)
35
36plt.title("TIC")
37plt.xlabel("time (s)")
38plt.ylabel("intensity (cps)")
39
40plt.show()